
I get asked often, "What are your favorite agile metrics to use?" or "which metrics should I be using?"
I'll start with the answer everyone hates to hear: well, it depends. Which outcome am I optimizing for? I'm going to go through my favorite agile metrics in just a minute. But first, let's talk about outcomes…
Just to make sure we're on the same page, the outcomes we (here at Sketch) drive toward are: predictability, quality, customer satisfaction, team happiness, alignment, adaptability, speed to market, and a culture of innovation. Organizations often think Agile will solve for all of these but we've found we cannot optimize for all at the same time - we have to prioritize. It should also be mentioned that no matter what outcome you optimize for you will still need to have a set of metrics in order to see if and where you might be suboptimizing. For instance, if you are optimizing for speed to market you'll also need to measure quality so that you don't over optimize for speed so much that quality declines, leading to customer satisfaction declining, and so on.
We've found that organizations tend to focus primarily on predictability, quality, and speed to market, because poor outcomes here are easily seen (and felt). In other words, there is low confidence in delivery commitments, too much time and money are spent fixing broken products, and everything just takes way too long. These outcomes, of course, are related – as are all of the seven outcomes I mentioned. But these three outcomes in particular lend themselves to relevant and easy-to-track agile metrics.
Metrics to Measure Predictability
When it comes to predictability, my favorite metric is churn. Churn tells you how much of your velocity was planned and how many things came in during the sprint. Teams that are tracking velocity alone could be unknowingly thinking things are going great. "We planned 50 points and we completed 50 points! Go us!" But with a churn metric in place they might see that out of the 50 points planned they completed only 2 points and the other 48 points were brought in during the sprint. That 96% churn rate means this team isn't very predictable at all. Their velocity is predictable, 50 points (assuming it hovers around there sprint over sprint). If the team's churn is high it means that it's unlikely the work they plan for the sprint will actually be the work that gets done.
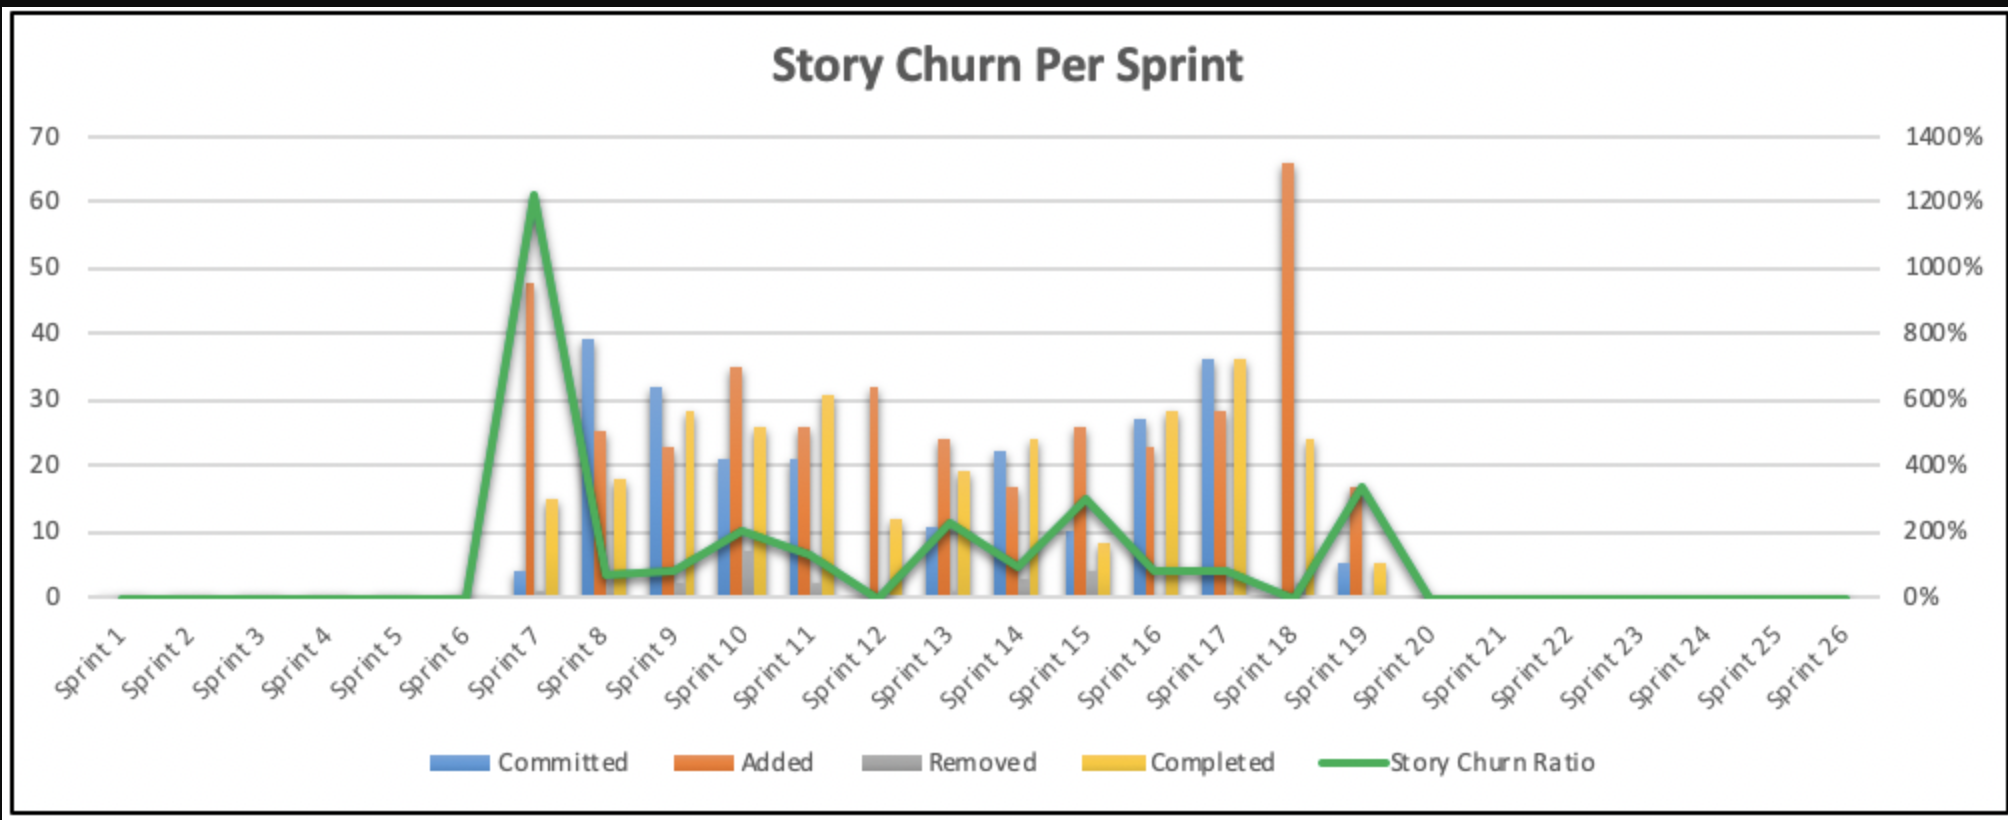
In this chart, your churn is that green line. You can't expect churn to always be zero but when churn starts to spike above 20% your team should investigate. Finding the root cause of the work being added during the sprint could uncover a variety of reasons. Uncovering and mitigating those reasons will help your team become more predictable.
Metrics to Track Quality
When it comes to quality, my favorite metric is defect escape rate. This is a two-fold metric in that we're tracking both internally and externally discovered defects. I prefer tracking both so I can see the relationship between our internal quality management and how much "escapes" to production. This isn't to suggest that the internal defect rate is captured at the 'Testing phase' of a linear SDLC. This information can be generated automatically as code changes are integrated into builds of working software in a DevOps pipeline. When addressing quality issues or tightening up our quality control, it's helpful to have this clearer picture of what's happening internally verses externally. We can make better decisions about what to adjust.
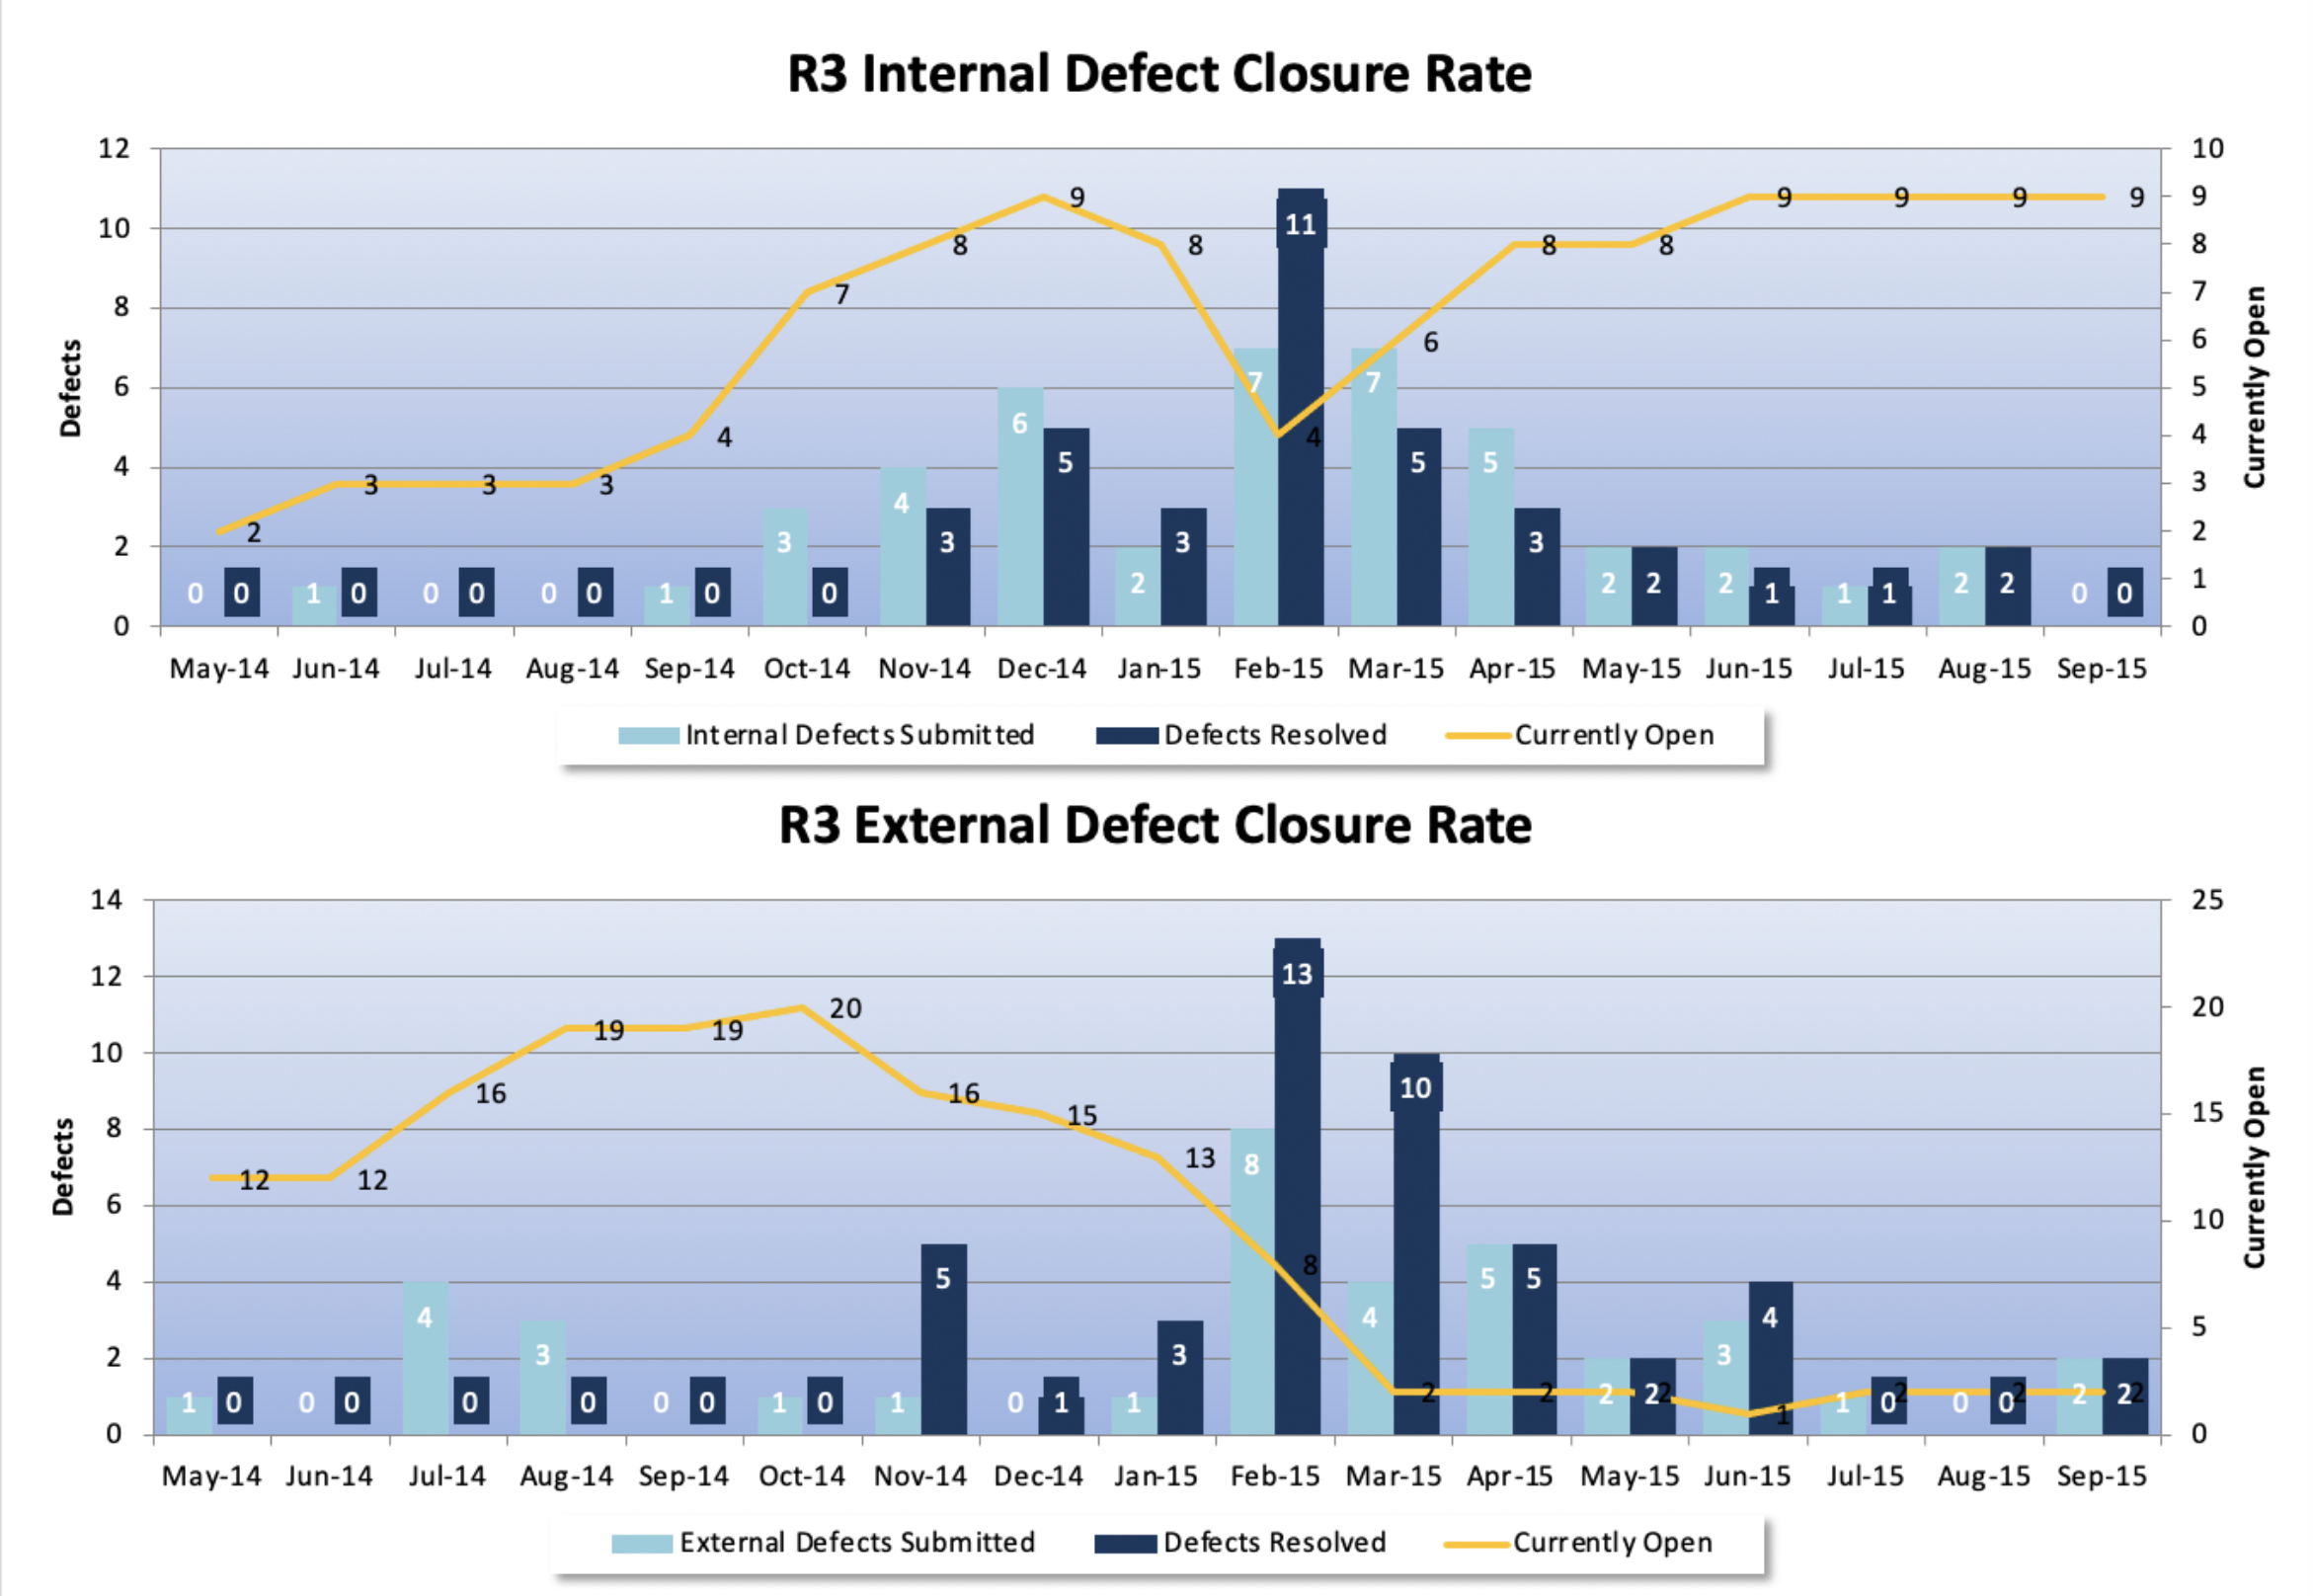
As you can imagine, digging into this metric can be a tough one. Approach it as a team in a quest for producing quality products rather than a blame game of fault. On a team with both developers and testers you want them working together to ensure quality. If your metrics are showing an increase in defects found externally your team will need to tighten up code quality and practices internally, prior to release. This might also indicate the need for more effective collaboration with the customer to understand their needs. The more defects found internally within the team, the less will be found externally by customers. Find the right quality practices such as peer reviews, test driven development, automated testing, or better version control to name a few. Uncover how to find defects before they enter production. Defects aren't a terrible thing when the team finds them first.
Best Metrics to Track for Speed to Market
When it comes to speed to market, my favorite agile metrics are lead time and cycle time. Bottom line: how long does it take something to get delivered to the customer from the time it gets into our backlog, and how long does it take something to get delivered once we start it? The difference between those two tells us how long items are just sitting in the backlog. It just doesn't get much more simple than that! Once we have this data we can dig into why things take a long time to get started and/or completed.
Along the same lines as speed to market, I love to tackle bottlenecks by looking at our Cumulative Flow Diagram. This visual generally looks like a pile of sediment. Each different color of sediment represents a different step in your workflow from "to do" to "done". The caveat here is that you need to have your workflow broken out into specific steps beyond the out of the box "to do, in progress, done" in order for this metric to be valuable. The longer it takes to move out of one step into another, the thicker the line gets because work piles up at that step. Thick lines are where your bottlenecks are happening. If you want to increase speed to market, you need to tackle your delays. This information helps you identify where those delays are typically happening.
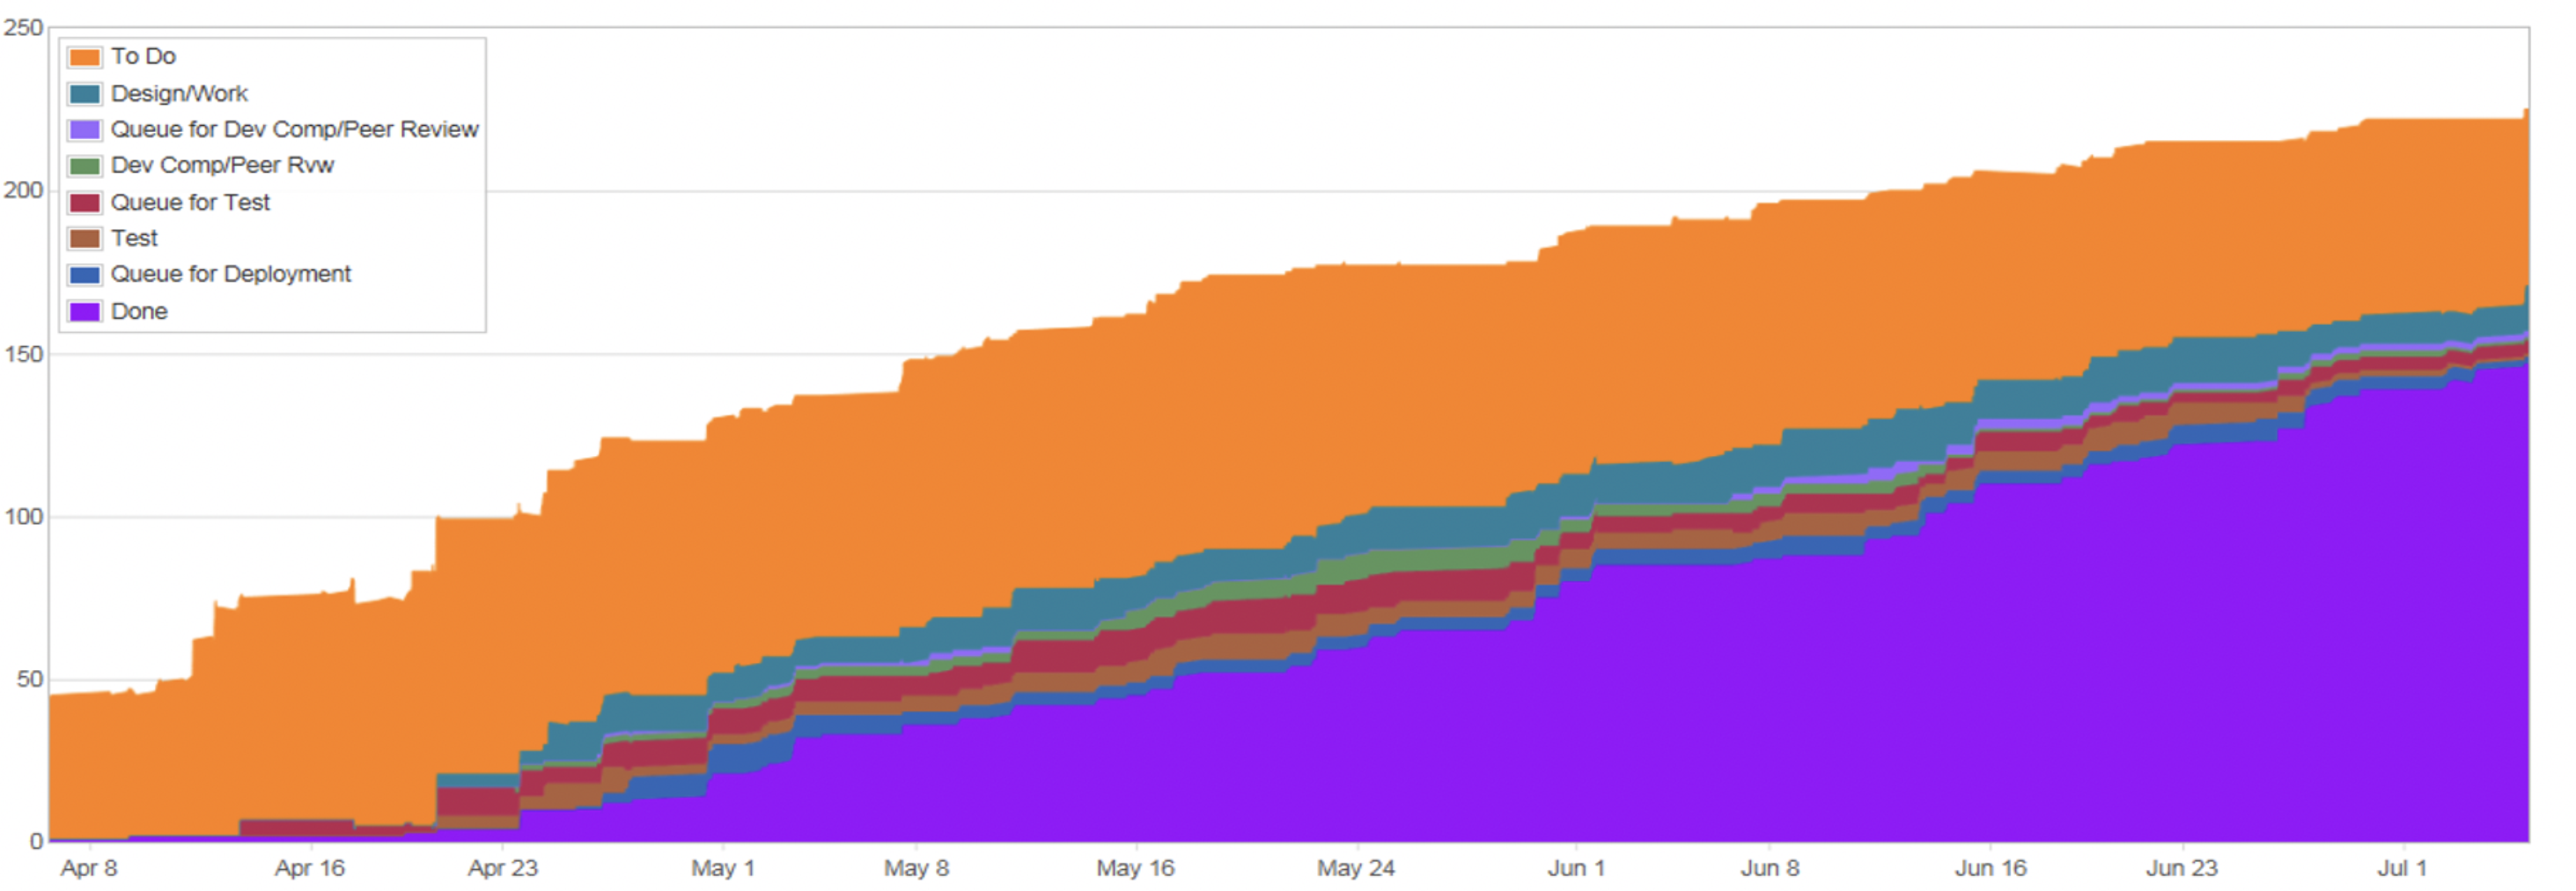
For this metric you'll want to focus in on the wider lines. Discover what's keeping work in that step for longer. Typically, the skinny lines and wide lines will be wildly different (think hours verses days.) Tackle one thing at a time as you work toward a smoother and faster flow of work through your system from "to do" to "done."
Unsure Where to Start with Agile Metrics?
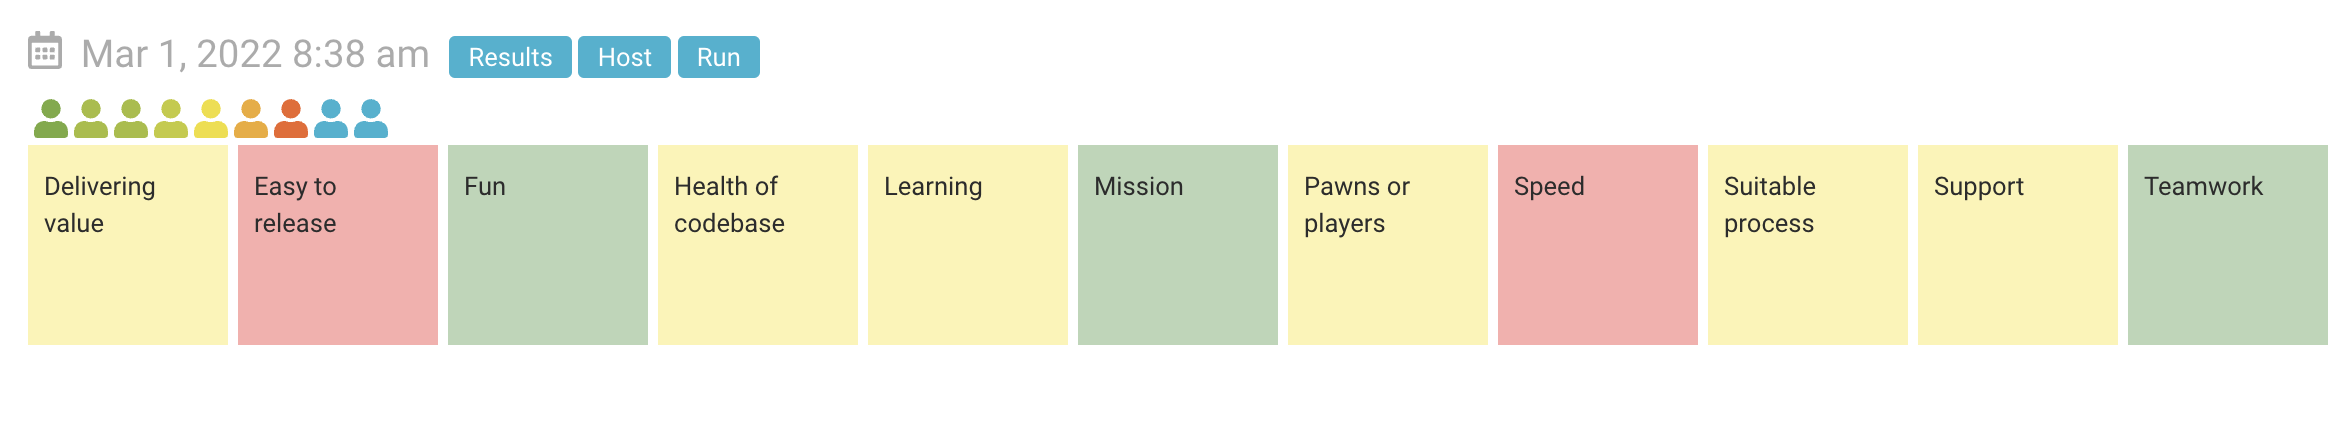
If you're not sure where to optimize, you may want to use a tool like Waypointr![]() . It's more objective than the measures mentioned above in that it's each person's perception and can serve as a great leading indicator of where you might need to put more objective measures in place. When I first enter an organization, I start with Waypointr so I know where I should focus my attention. The pain points people indicate in this data give us the areas where they are willing to improve at this point in time. (Another blog coming up discussing how and why these measures might change)
. It's more objective than the measures mentioned above in that it's each person's perception and can serve as a great leading indicator of where you might need to put more objective measures in place. When I first enter an organization, I start with Waypointr so I know where I should focus my attention. The pain points people indicate in this data give us the areas where they are willing to improve at this point in time. (Another blog coming up discussing how and why these measures might change)
We use this Waypointr live assessments to measure everything from team health checks with only 11 questions, to more in depth assessments with over 100 questions, to combining large assessment results into org health results.
I like to use the team health check most frequently to see where we need to focus at the team level. It's a lightweight, quick survey so it's perfect for using each week or two to find out where a team might be struggling or shining. This frequency allows us to respond quickly to speed bumps rather than waiting and potentially missing an opportunity to improve something quickly. I like to use the more in-depth assessment to create an improvement backlog and reassess quarterly. It's more time consuming and gives a lot more rich data to work with so it's worth doing on a regular cadence.
These should spark some ideas for you about which agile metrics you need to start measuring in order to improve outcomes you care about!